Monitoring Management
12007Function Overview
Monitoring management refers to the usage status of basic resources in the monitoring system, allowing us to intuitively understand the system's condition. Monitoring is turned off by default and can be enabled as needed. Monitoring data is saved for 30 days by default, which can be modified. The default monitoring data is stored in logs, which can be manually cleared; once cleared, previous monitoring information will be lost, so caution is advised during this process.
1. Enabling Monitoring
Monitoring the server's operational status is a key part of ensuring its stable and efficient operation. To enable monitoring, find the "Enable Monitoring" option on the page and toggle the switch:

The monitored data includes:
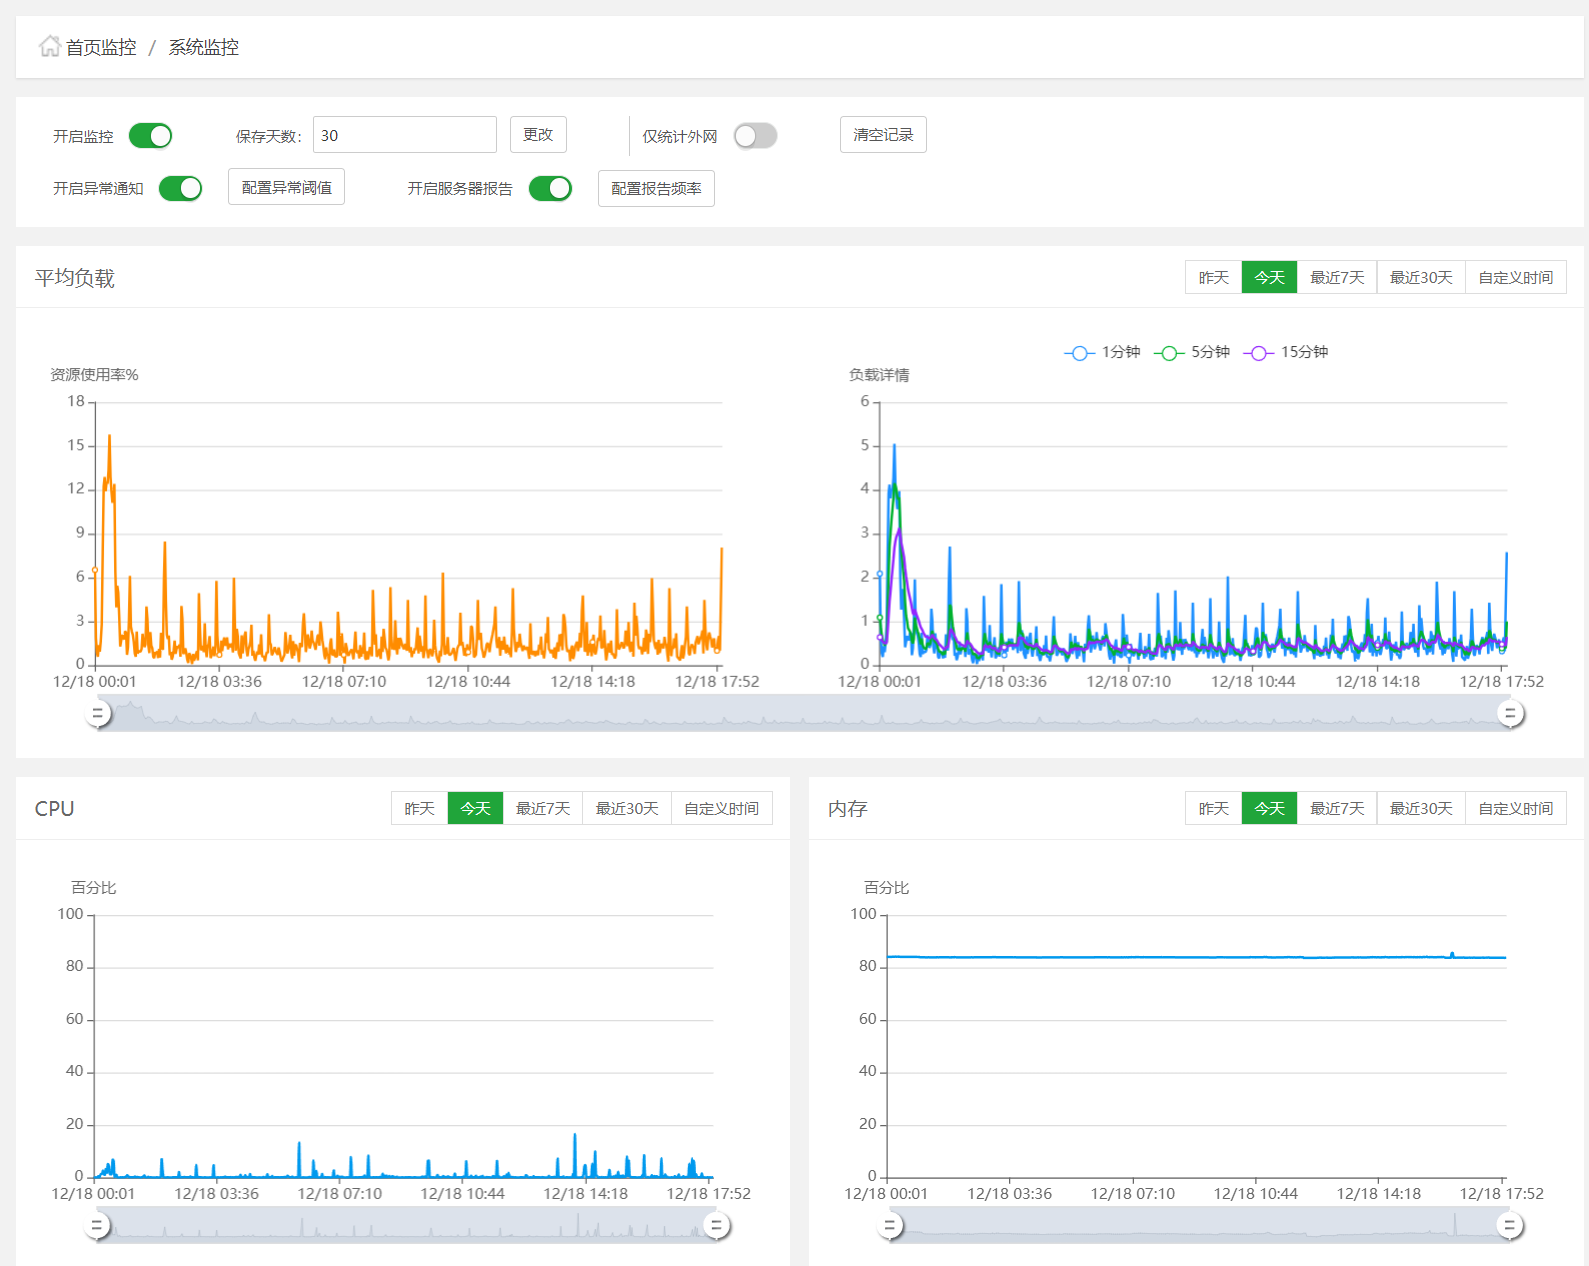
- Average System Load:
By default, it loads the average load of the system for the current day. You can also view the average load fluctuations for yesterday, the last 7 days, the last 30 days, or a custom time period. Additionally, you can slide the time progress bar to view monitoring information for different times.

- CPU:
By default, it loads the CPU usage for the current day. You can also view the average load fluctuations for yesterday, the last 7 days, the last 30 days, or a custom time period. Additionally, you can slide the time progress bar to view monitoring information for different times.

- Memory:
By default, it loads the memory usage for the current day. You can also view the average load fluctuations for yesterday, the last 7 days, the last 30 days, or a custom time period. Additionally, you can slide the time progress bar to view monitoring information for different times.

- Disk I/O:
By default, it loads the disk I/O usage for the current day. You can also view the average load fluctuations for yesterday, the last 7 days, the last 30 days, or a custom time period. Additionally, you can slide the time progress bar to view monitoring information for different times.

- Network I/O:
By default, it loads the network I/O usage for the current day. You can also view the average load fluctuations for yesterday, the last 7 days, the last 30 days, or a custom time period. Additionally, you can slide the time progress bar to view monitoring information for different times.

2. Using Monitoring Reports
On the monitoring page, you can see real-time data and historical trends for various server metrics. By comparing and analyzing monitoring data, you can promptly identify any anomalies in the server.
- By customizing the date, you can find the exact time to view the data.

- If an abnormal waveform is detected, hovering the mouse over the waveform chart will display specific monitoring information.

3. Enabling Abnormal Monitoring Email Notifications
First, enable the email Email Notification feature in the "Panel Settings." Then, toggle the switch for "Enable Abnormal Notifications" on the monitoring management page:

Once enabled, you can configure the abnormal thresholds for various data in the "Configure Abnormal Thresholds" section:

This way, if any data becomes abnormal, the abnormal information will be sent to the user's email.
4. Enabling Server Reports
The Jianghu panel also provides the functionality to generate server reports, which can organize various parameters of the server's operational status into a report and send it to users via email regularly, allowing users to stay informed about the server's operational status and identify issues promptly.
Toggle the switch for "Enable Server Reports" on the monitoring management page:

Once enabled, you will see the "Configure Report Frequency" button. Click to set the frequency for sending reports; the system will send server reports according to the configured frequency:

5. Clearing Records
You can manually clear data records. Please note that once cleared, previous monitoring information will be lost, so this operation should be approached with caution!
