Debug Debugging
120031. Introduction to Debugging
Why Debugging
- Locating Issues: The primary purpose of debugging is to help programmers locate and resolve errors or exceptions in the code. Through debugging, the execution process of the program can be traced to find the exact point of failure.
- Verifying Logic: Sometimes, the code logic may not function as expected. Debugging allows for step-by-step execution of the code to verify whether each step's logic aligns with the design and expectations.
- Performance Optimization: In addition to resolving errors, debugging is also used for performance optimization. By observing the program's operation, performance bottlenecks can be identified for targeted optimization.
- Testing and Validation: During the development or modification of new features, debugging is an important means of testing and validation. By executing the code step by step, the correctness of new features or modifications can be ensured.
2. Chrome Debugging
EggJS has built-in Chrome DevTools that can be used for debugging. The specific steps are as follows:
1. Start the application: npm run dev or npm start.
2. Open the page using Chrome, right-click on a blank area of the page, and select Inspect to enter Chrome DevTools.
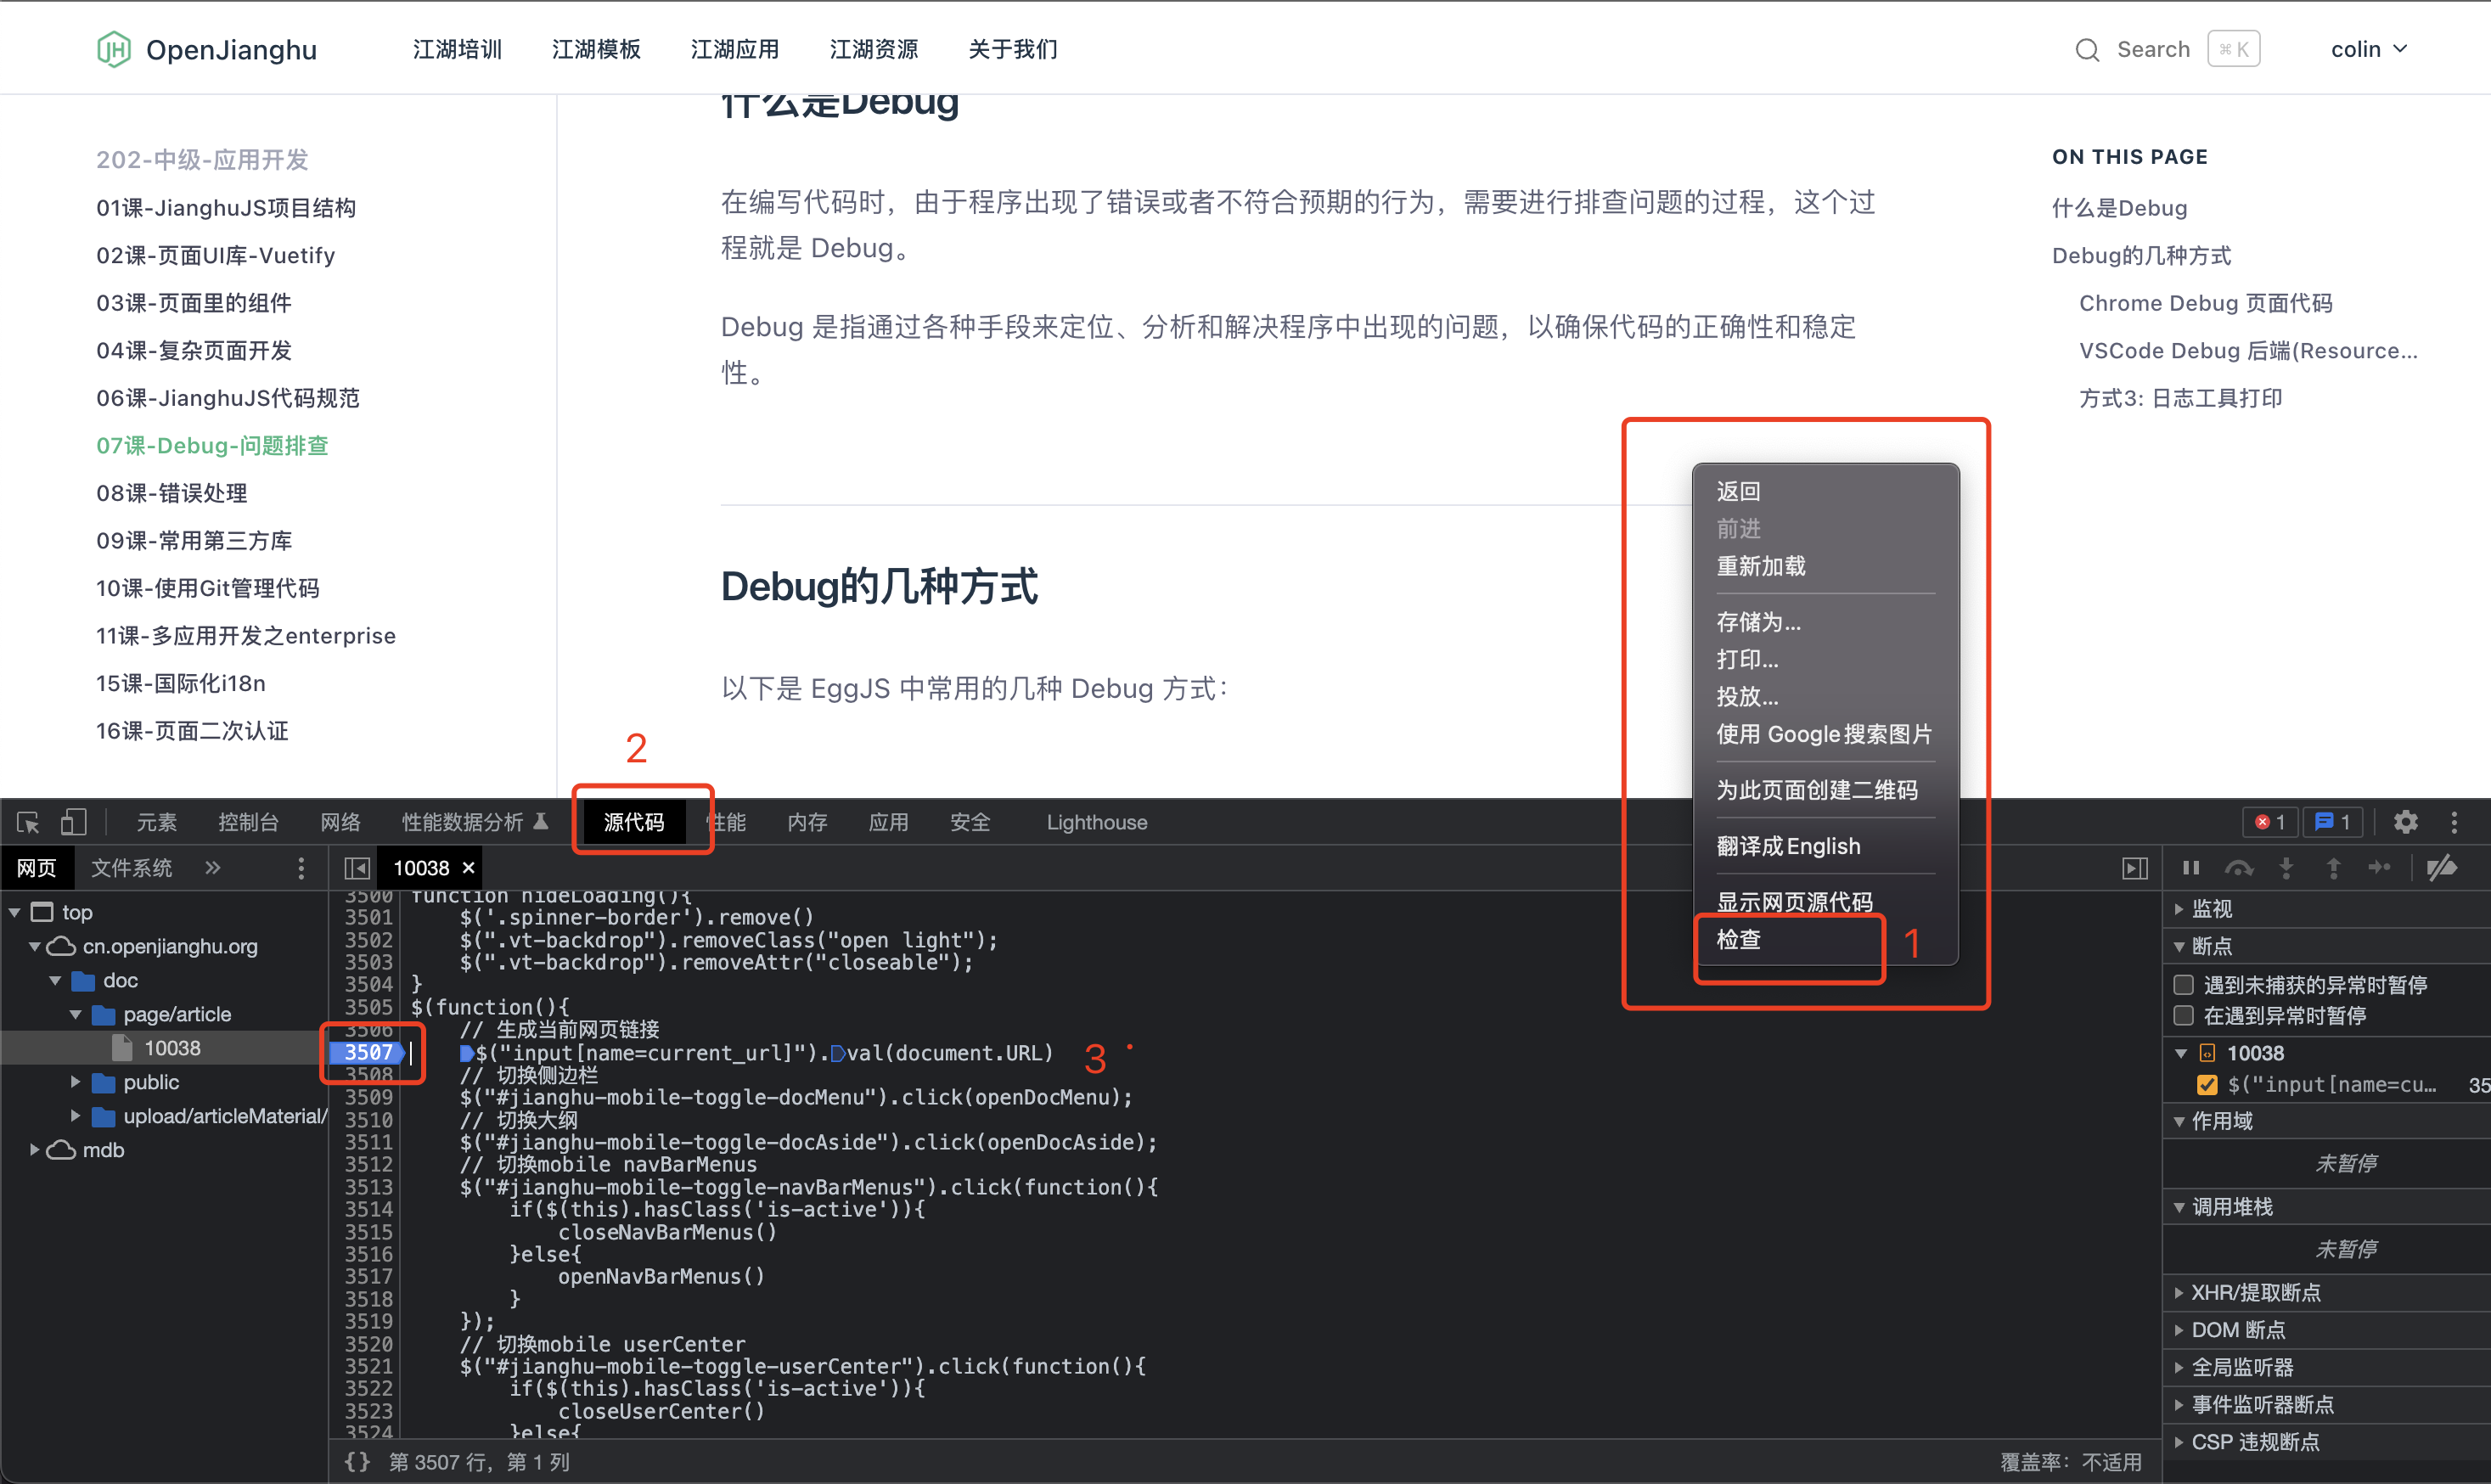
3. Click the Sources tab, find the file you want to debug in the directory tree on the left, and set breakpoints in the code you want to debug.
4. Refresh the page, and Chrome will pause at the breakpoints you set.
3. VSCode Debugging Backend (Resource) Code
Debugging Npm Projects
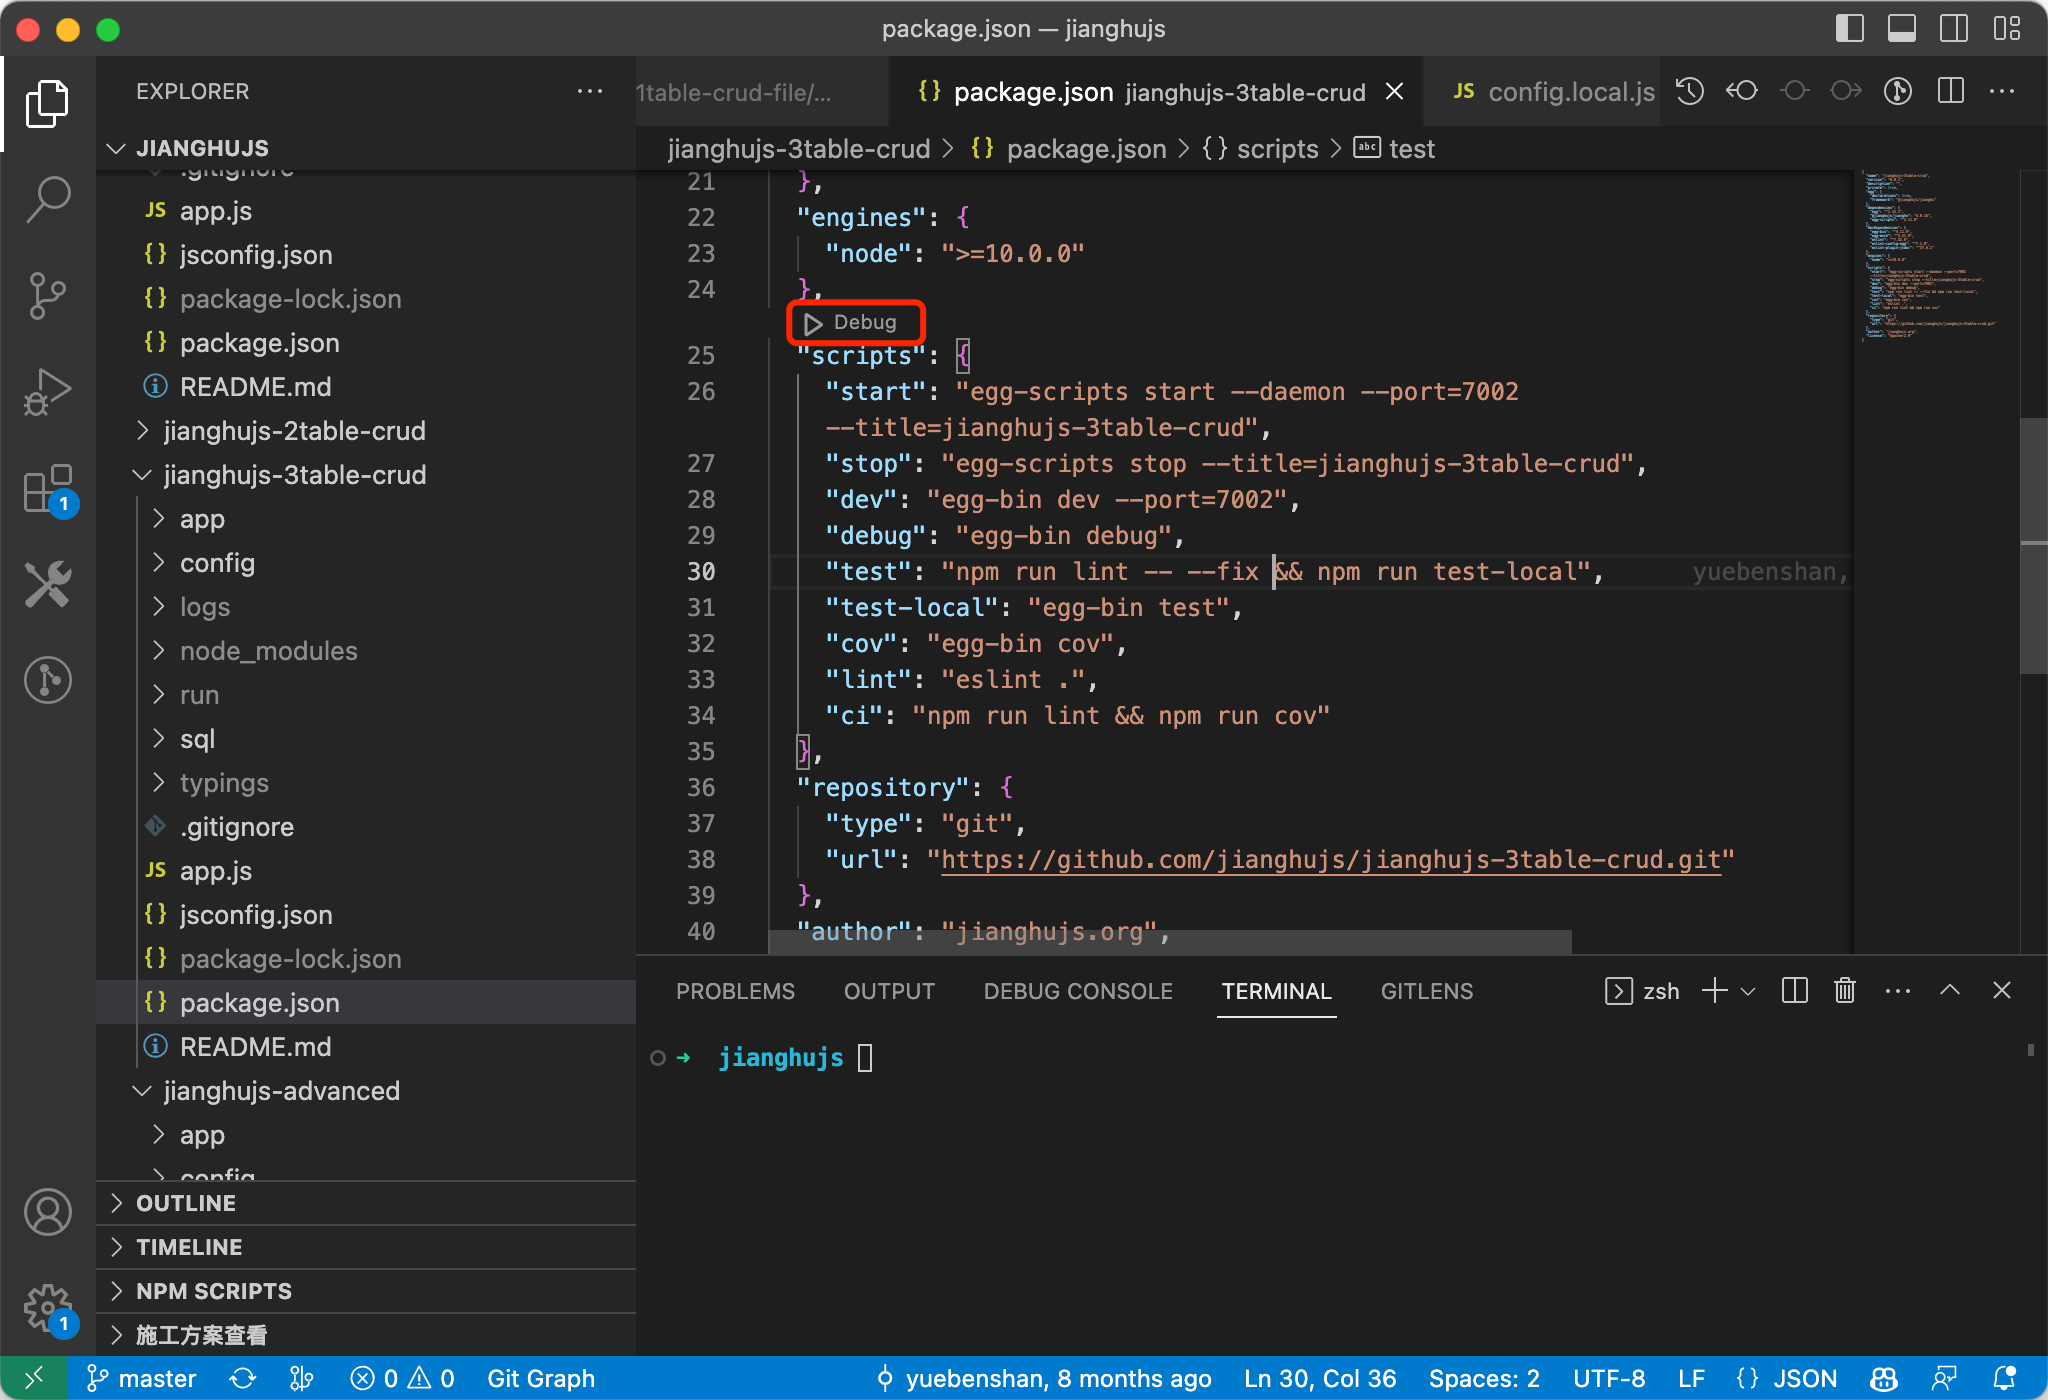
An Npm project refers to a project that includes a package.json file. You can directly open the package.json file, find the "Debug" button above the scripts, and select the script you want to debug.
You can then see the program's running logs in the Terminal below, and proceed with breakpoint debugging.
You can see that the functionality is quite comprehensive; the floating buttons above allow for step-by-step execution, service restarts, and other operations. The terminal below displays program output, while the left side shows context variables, variable watches, call stacks, and breakpoint management.
You can also execute JavaScript scripts in the "Debug Console" while in breakpoint mode:
The issue with starting debugging this way is that this debugging scheme is temporary, so after stopping debugging, you cannot re-enter debugging without reopening package.json and clicking Debug again. If you want a fixed debugging scheme, you can refer to the "Configured Debugging Method" section below.
Debugging Node Scripts
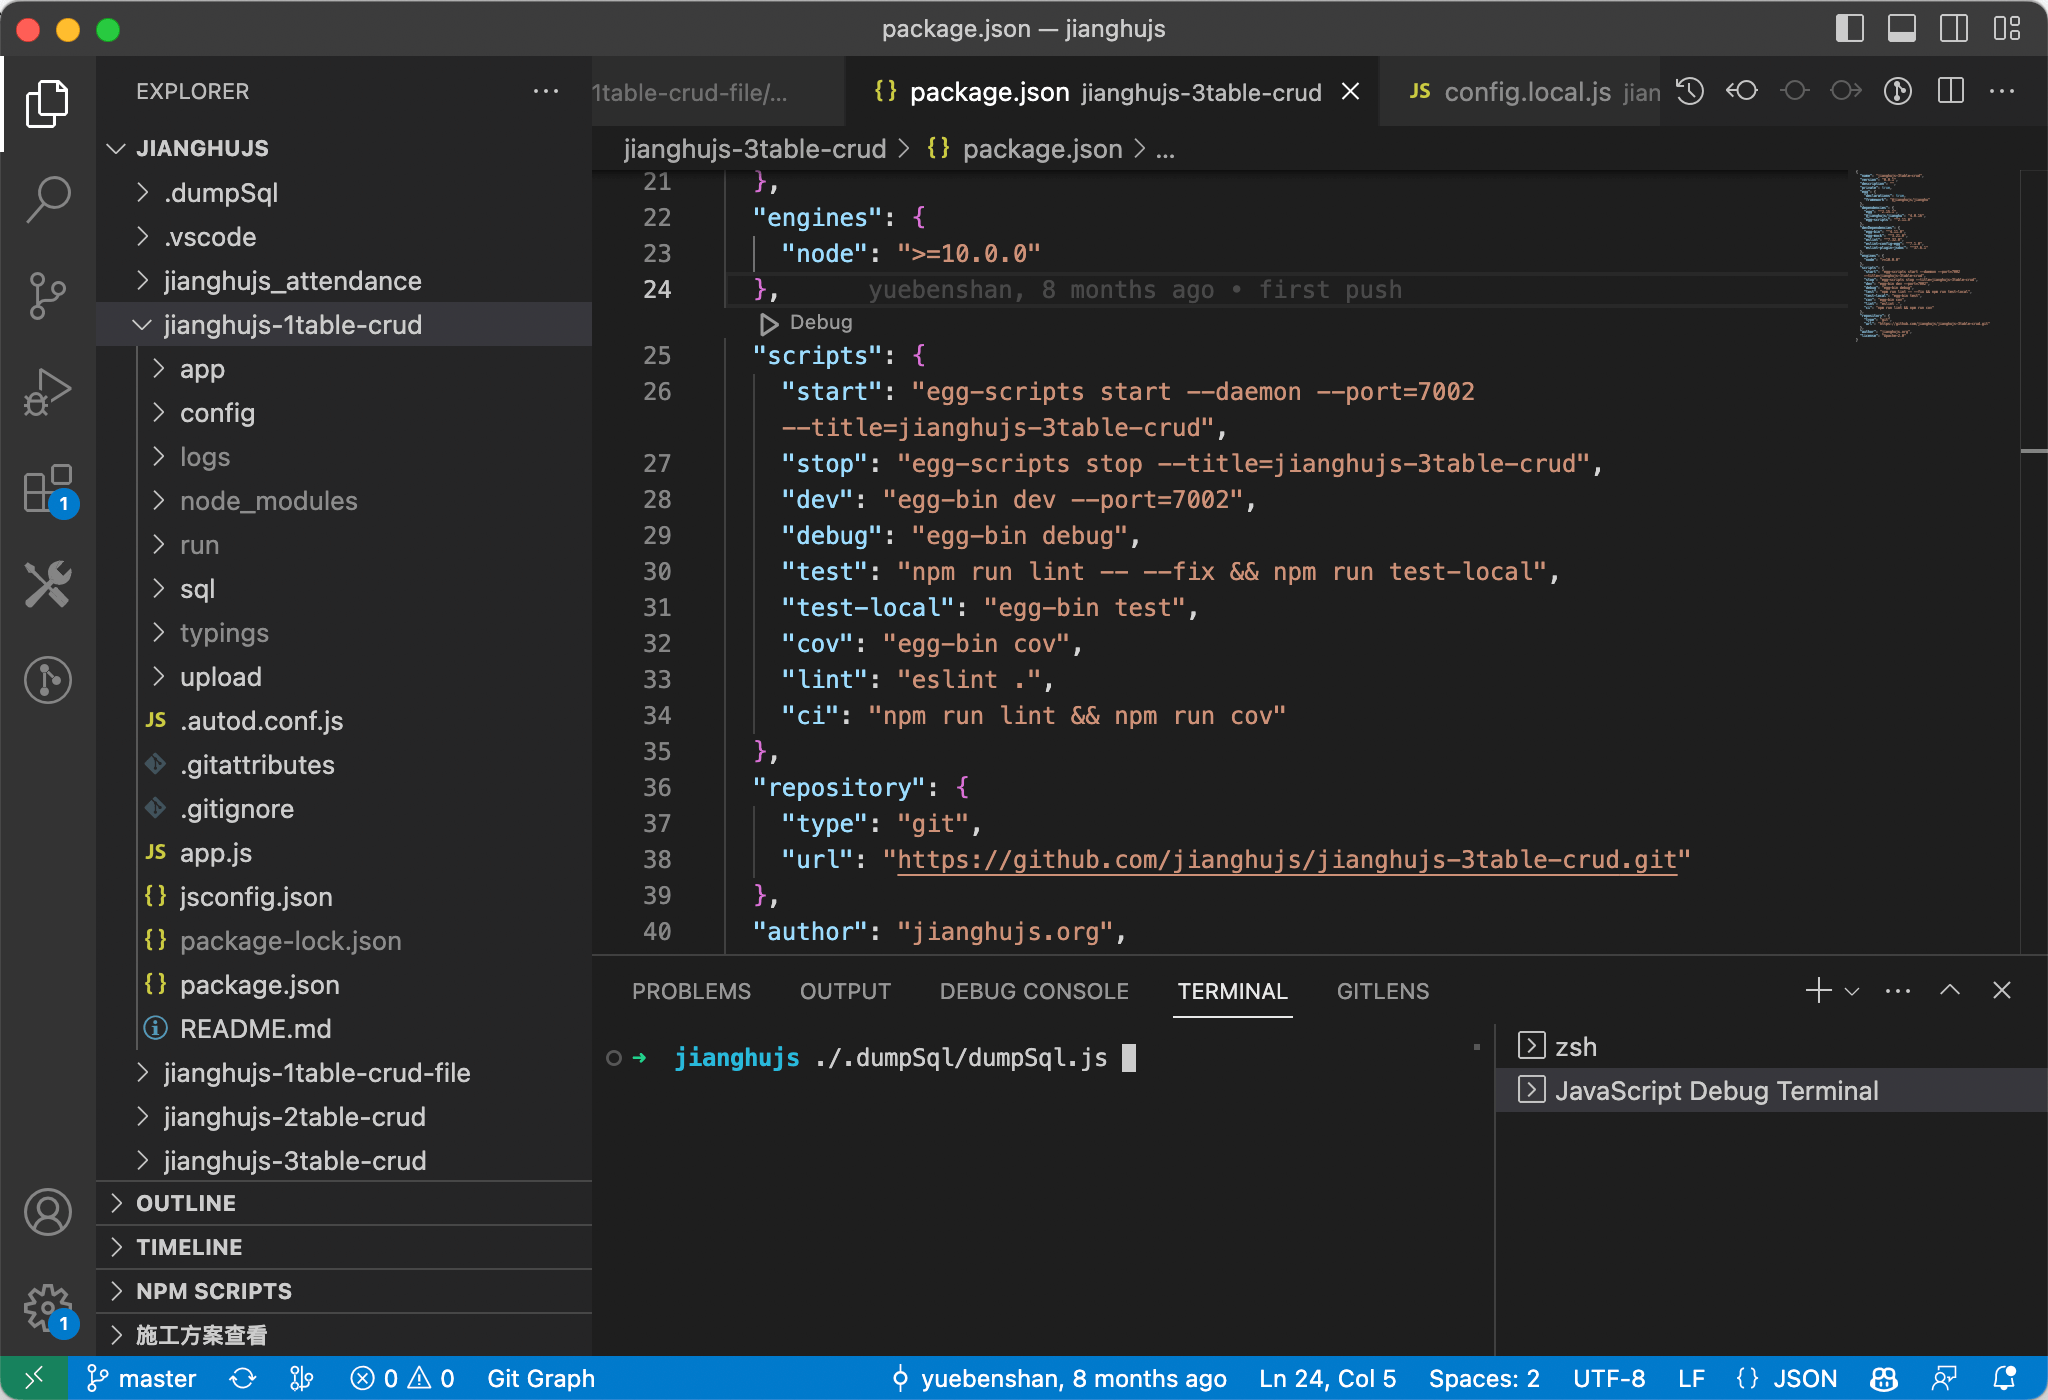
Debugging Node scripts is also straightforward; you just need to create a Debug Terminal in the terminal and execute your Node command to enter debugging mode.
This debugging method is also applicable to Npm projects.
Recommended Configured Debugging Method
Both of the above debugging methods have a common issue: you have to repeat the operations every time you stop to debug.
VSCode offers a more flexible debugging method by configuring the debugging approach and saving the debugging scheme in the .vscode/launch.json file.
After entering the Debug interface, click "create a launch.json file" to create the configuration file, and select the Node type (if it is an Egg.js project, you can also create an Egg type, which requires the installation of the "eggjs" plugin).
Modifying launch.js allows for various debugging effects; here is a template:
{
    "version": "0.2.0",
    "configurations": [
        {
            "command": "npm --prefix=jianghujs_demo_basic run dev",
            "name": "jianghujs_demo_basic",
            "request": "launch",
            "type": "node-terminal"
        }
    ]
}
4. Logging Tool Output
We can print debugging information using logging tools.
For backend resources, we use app.logger:
1. Add logging code in the code, for example: app.logger.info('info message').
2. Start the application: npm run dev or npm start.
3. Check the log output information in the console.
For frontend pages, we use console.log:
1. Add logging code in the code, for example: console.log('info message').
2. Refresh the page to see the log output information in the Chrome console.