JianghuJS-Debug
120021. Introduction
Why Debugging
- Locating Issues: The primary purpose of debugging is to help programmers identify and resolve errors or exceptions in the code. Through debugging, one can trace the execution process of the program and find the specific location of the error.
- Verifying Logic: Sometimes, the logic of the code may not run as expected. Debugging allows for step-by-step execution of the code to verify whether each step's logic aligns with the design and expectations.
- Performance Optimization: In addition to resolving errors, debugging is also used for performance optimization. By observing the program's operation, one can identify performance bottlenecks and perform targeted optimizations.
- Testing and Validation: During the development or modification of new features, debugging is an important means of testing and validation. By executing the code step-by-step, one can ensure the correctness of new features or modifications.
Various Methods of Debugging:
- Logging: Inserting print statements in the code to output the values of key variables or the current execution step. This is a simple yet effective debugging method.
- Breakpoint Debugging: Setting breakpoints in the code, which pause execution when the program reaches the breakpoint, allowing for line-by-line inspection of the code execution and variable values.
- Step Execution: Using the step execution feature to execute the code step-by-step, observing the results of each step to help identify issues.
- Exception Handling: Utilizing exception handling mechanisms to capture runtime exceptions, outputting relevant information to aid in quickly locating problems.
- Visualization Tools: Some Integrated Development Environments (IDEs) provide visual debugging tools, such as debuggers, which allow observation of the program's execution flow in a graphical interface.
- Static Code Analysis: Using static code analysis tools to perform static checks on the code, identifying potential issues for early remediation.
Debugging is an indispensable part of the software development process. It is not only about resolving errors in the code but also an important tool for helping developers understand the code, improve code quality, and enhance performance.
2. Chrome Debug
EggJS has built-in Chrome Devtools that can be used for debugging. The specific steps are as follows:
1. Start the application: npm run dev or npm start.
2. Open the page using Chrome, right-click on a blank area of the page, and select Inspect to enter Chrome Devtools.
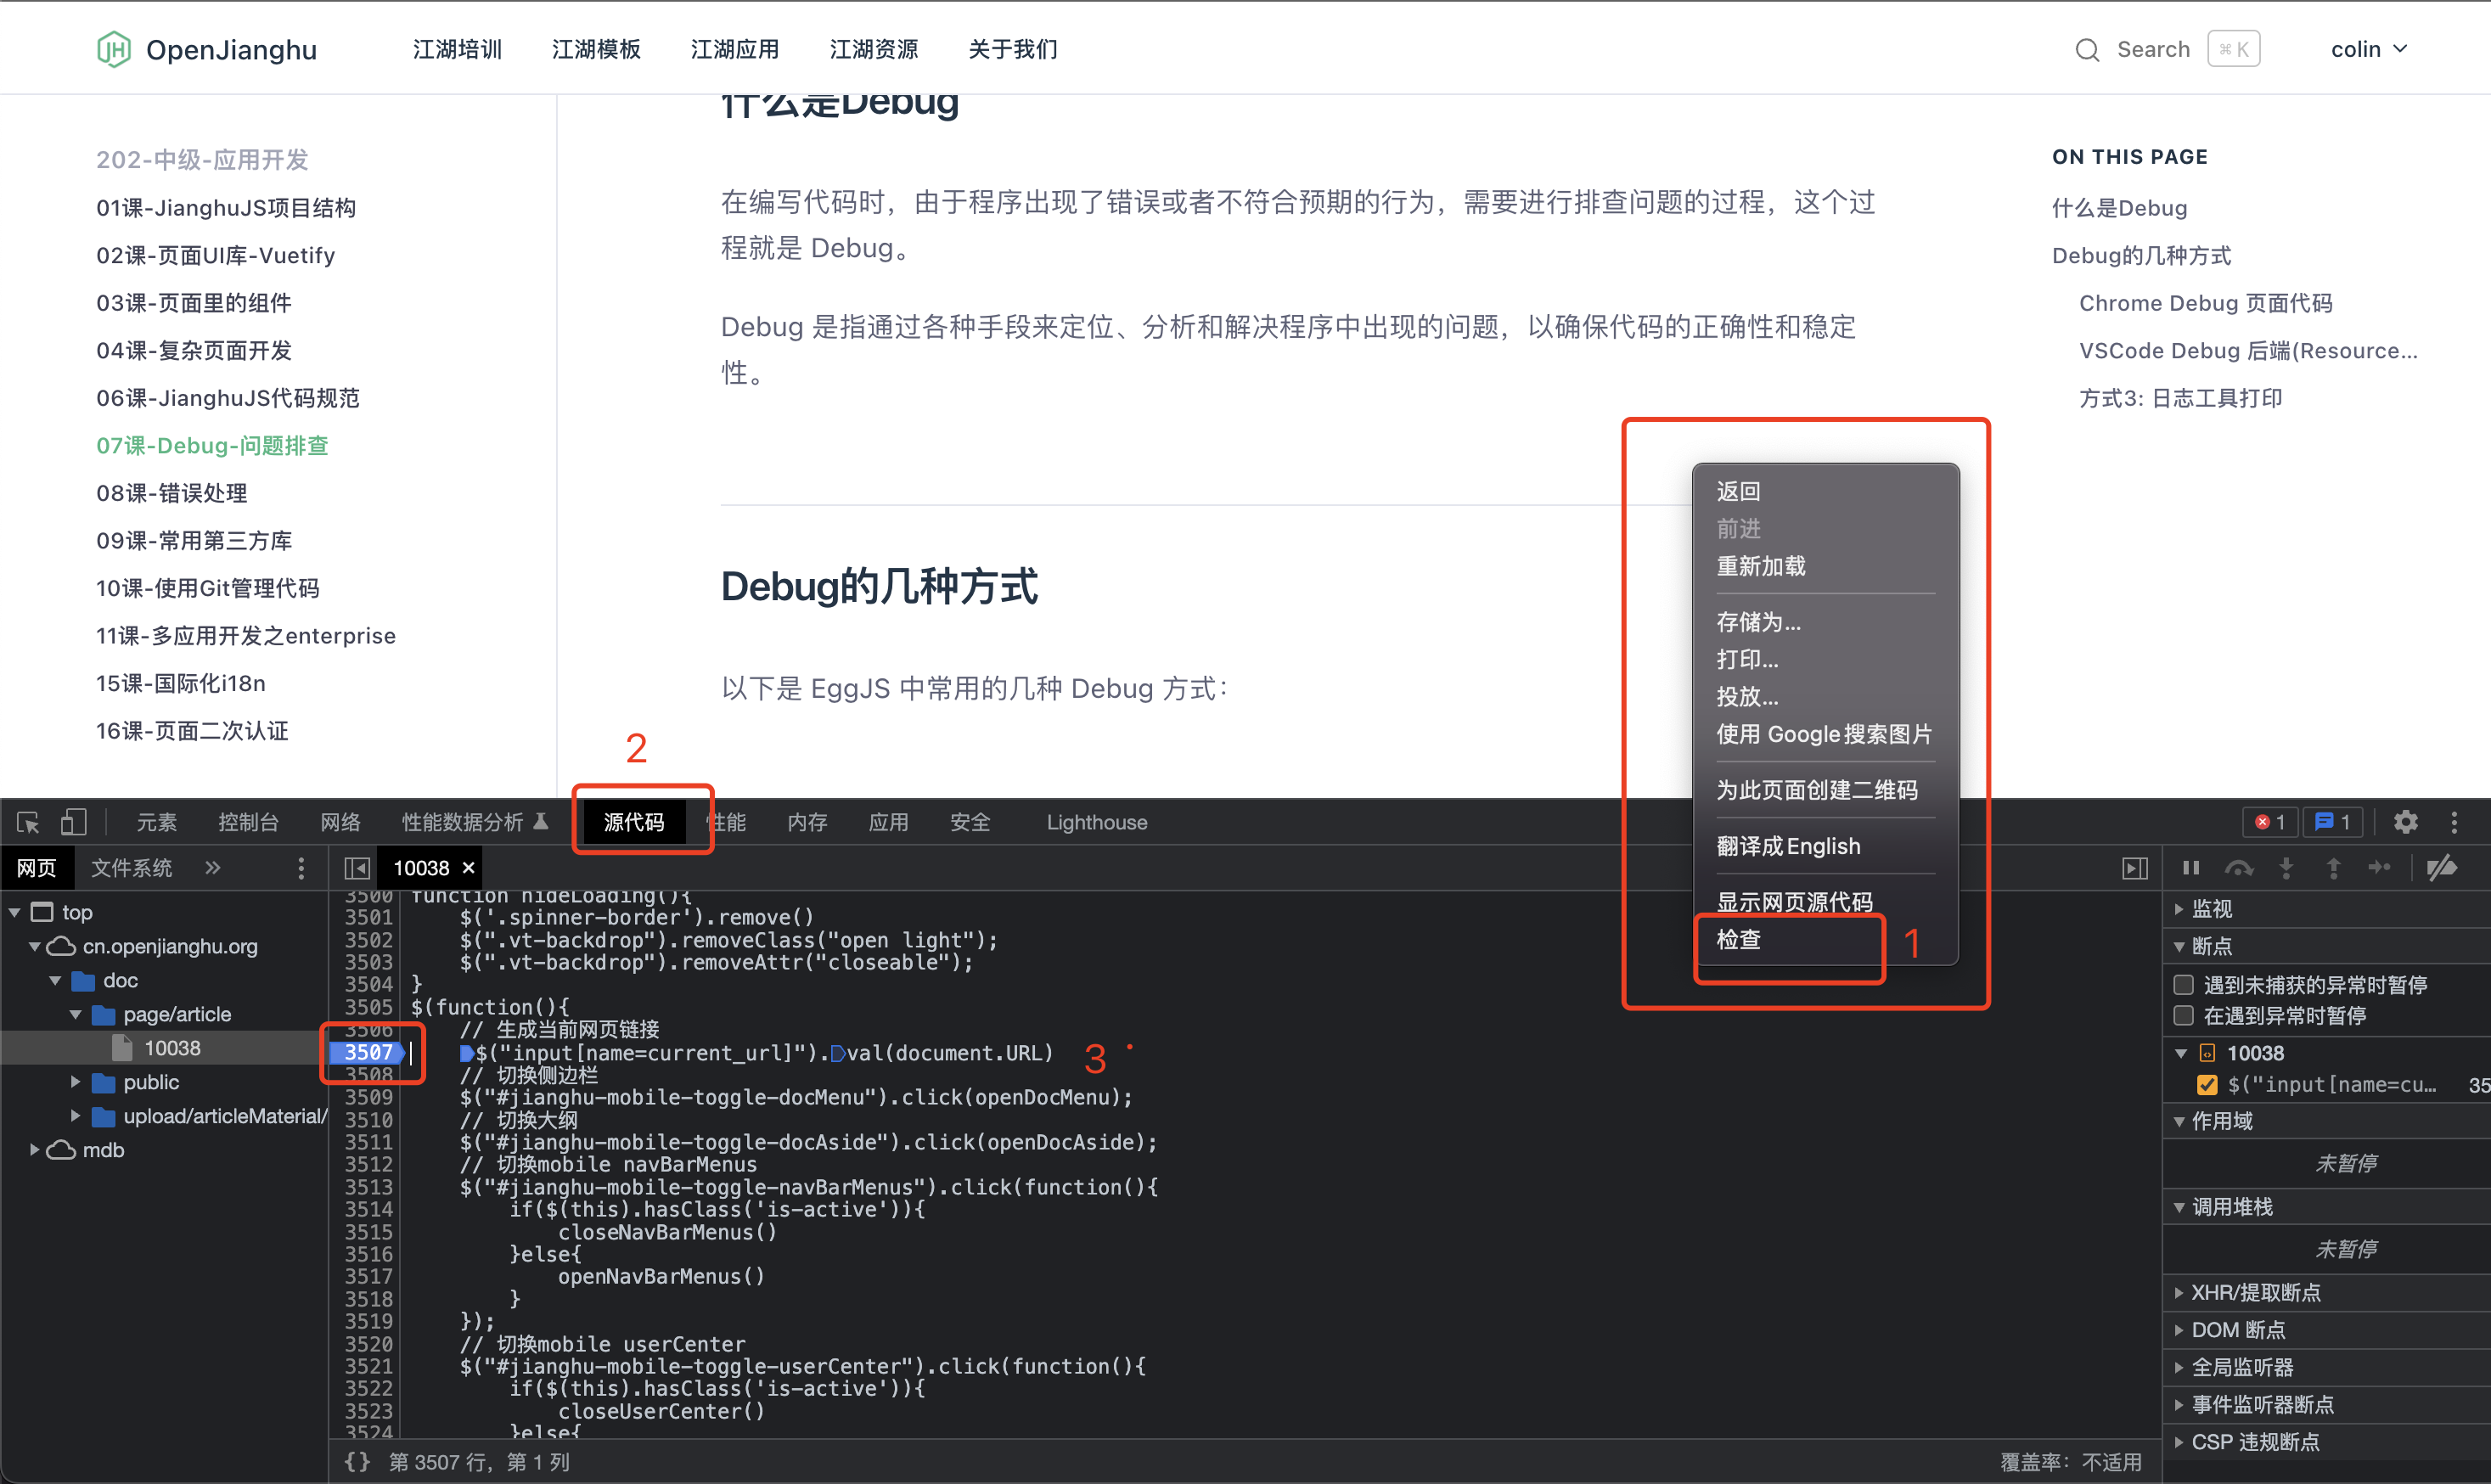
3. Click on the Sources tab, find the file you want to debug in the left directory tree, and set breakpoints in the code you want to debug.
4. Refresh the page, and Chrome will stop at the breakpoint you just set.
3. VSCode Debug Backend (Resource) Code
Debugging Npm Projects
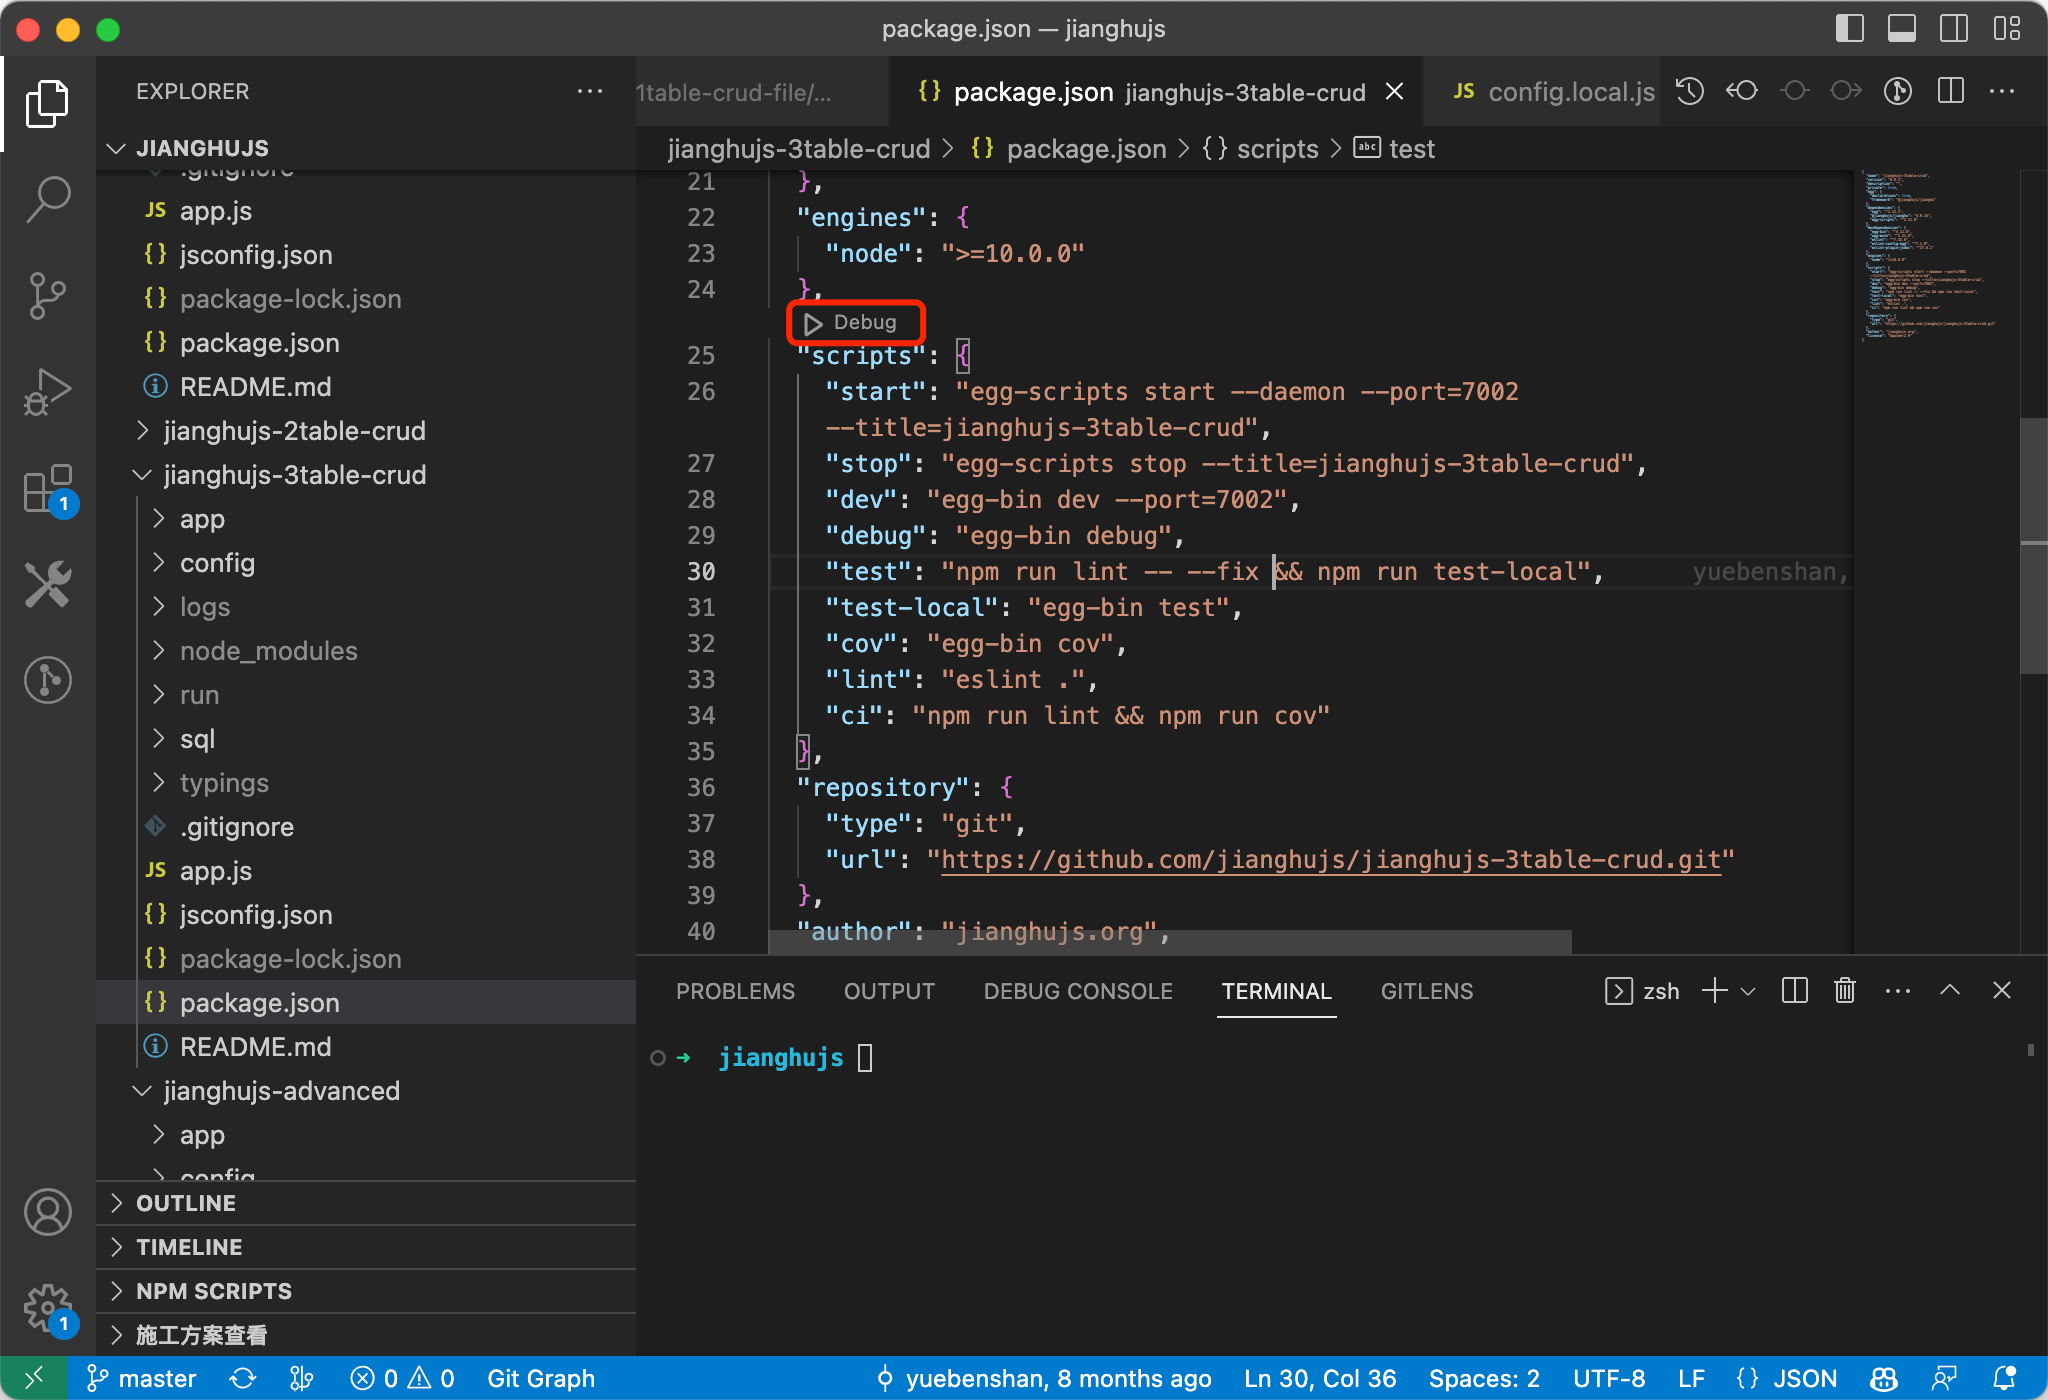
An Npm project refers to projects that contain a package.json file. You can directly open the package.json file, find the "Debug" button above the scripts, and select the script you want to debug.
The program's running logs will be displayed in the Terminal below, allowing for breakpoint debugging.
You can see that the functionality is quite comprehensive; the floating buttons above allow for step execution, restarting the service, etc., while the terminal below displays program output, and the left side shows context variables, variable watches, call stacks, and breakpoint management.
You can also execute JS scripts in the "Debug Console" while in breakpoint mode:
The issue with this debugging method is that it is temporary, so after stopping debugging, you cannot re-enter debugging without reopening package.json and clicking Debug again. If you want a more permanent debugging solution, you can refer to the "Configured Debugging Method" section below.
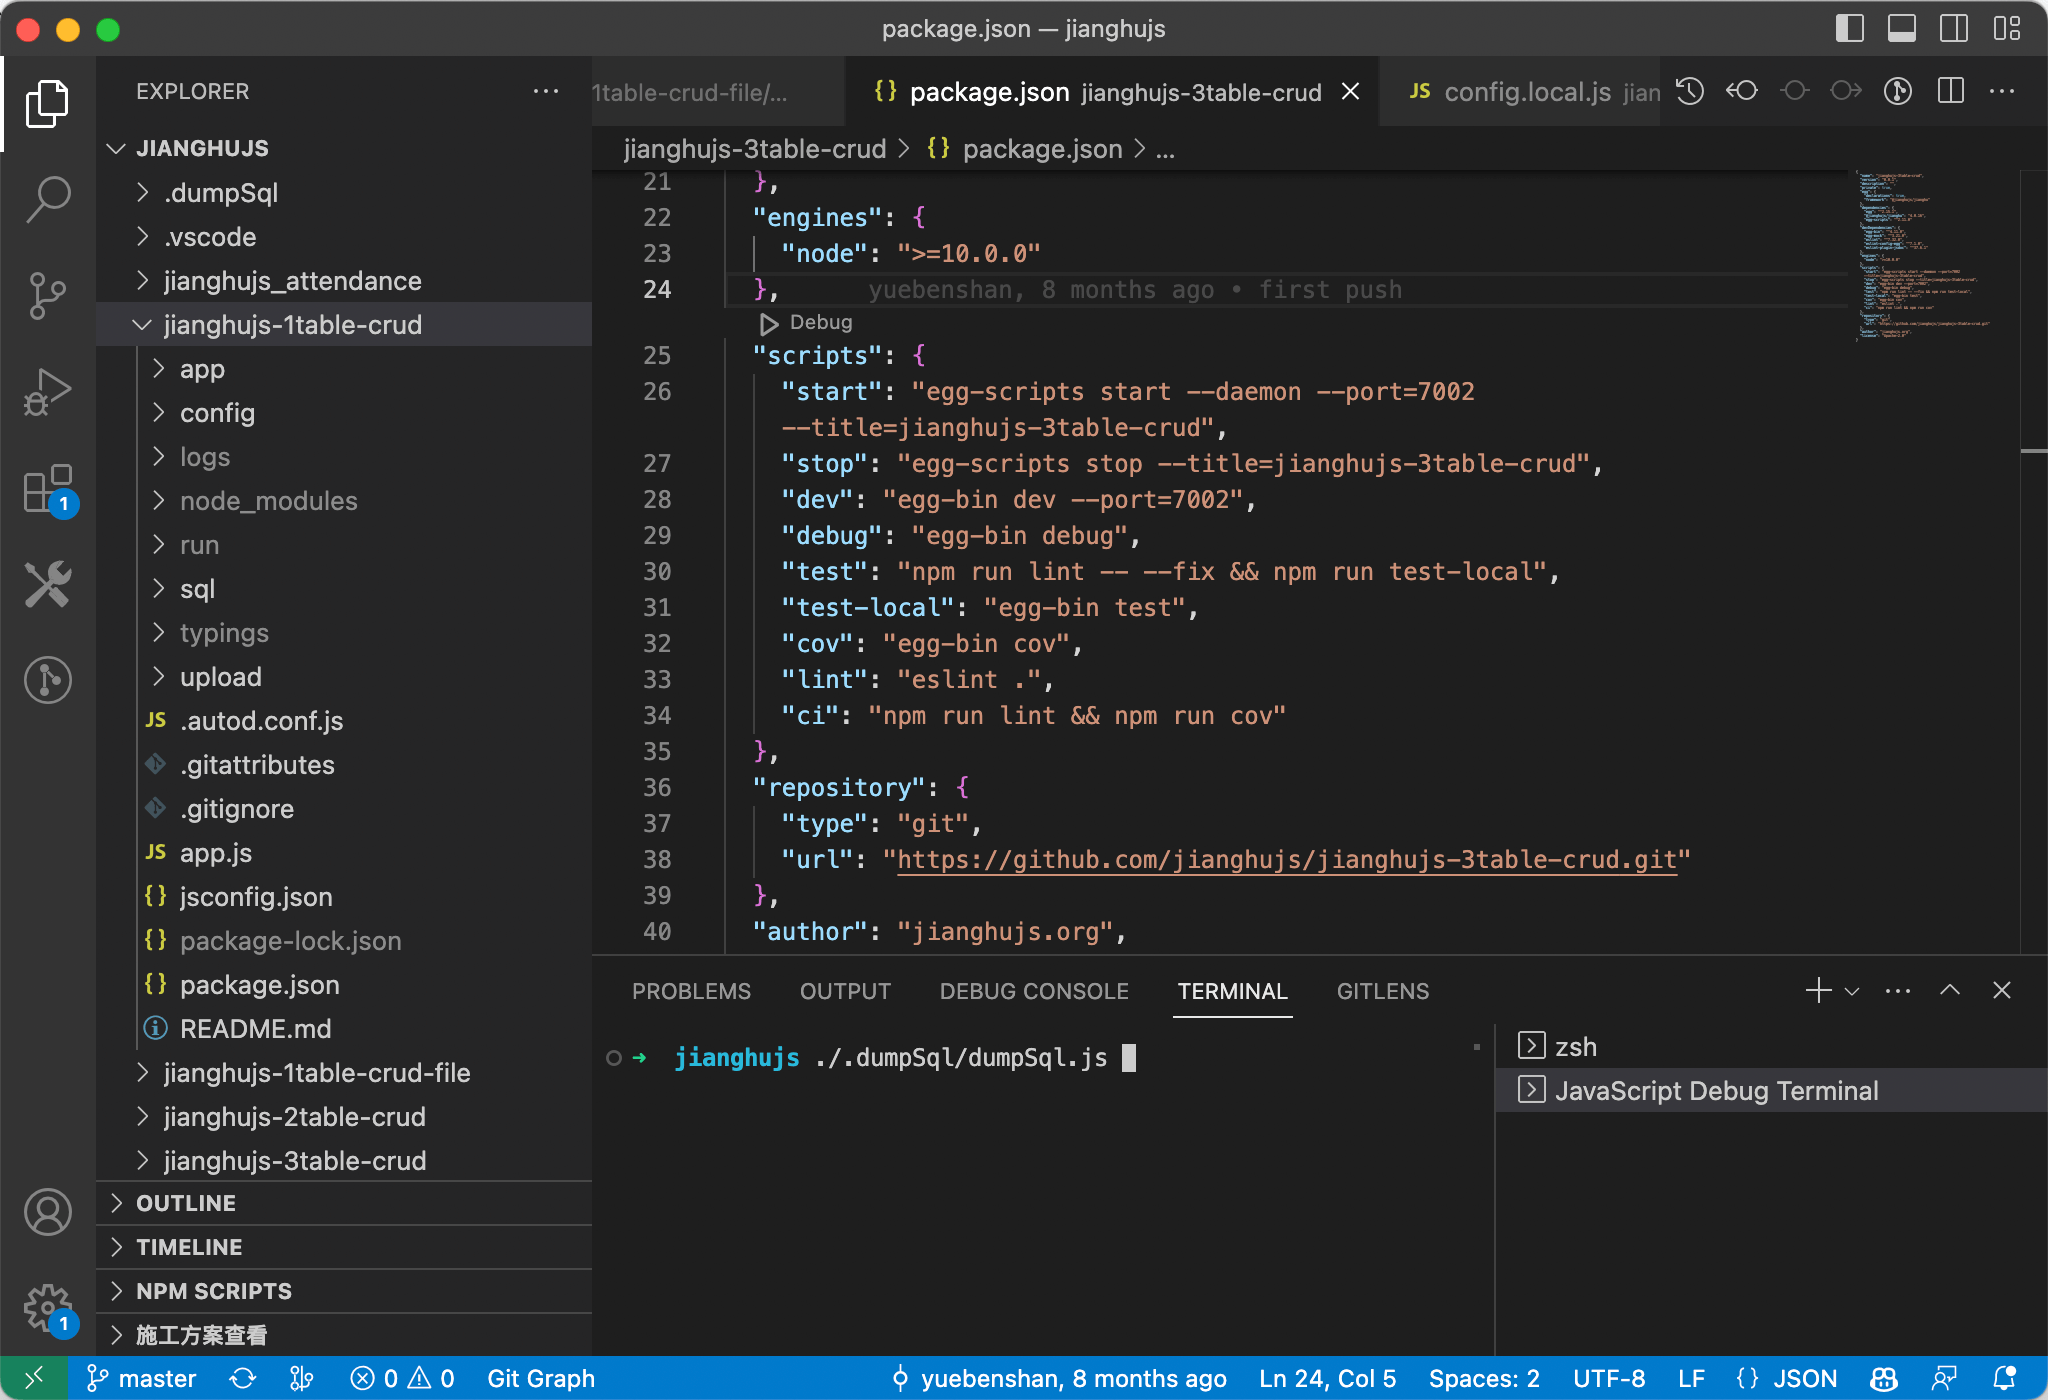
Debugging Node Scripts
Debugging Node scripts is also straightforward; simply create a Debug Terminal in the terminal and execute your Node command to enter debugging mode.
This debugging method also applies to Npm projects.
Recommended Configured Debugging Method
Both of the above debugging methods have a common issue: you have to repeat the steps each time you stop debugging to start again.
VSCode offers a more flexible debugging method by allowing you to configure the debugging setup and save it in the .vscode/launch.json file.
After entering the Debug interface, click "create a launch.json file" to create a configuration file, selecting the Node type (if it is an Egg.js project, you can also create an Egg type, which requires installing the "eggjs" plugin).
Modifying launch.js allows for various debugging effects; here is a template:
{
    "version": "0.2.0",
    "configurations": [
        {
            "command": "npm --prefix=jianghujs_demo_basic run dev",
            "name": "jianghujs_demo_basic",
            "request": "launch",
            "type": "node-terminal"
        }
    ]
}
4. Logging Tool Output
We can print debugging information using logging tools.
For backend resources, we use app.logger:
1. Add logging code in the code, for example: app.logger.info('info message').
2. Start the application: npm run dev or npm start.
3. Check the log output information in the console.
For frontend pages, we use console.log:
1. Add logging code in the code, for example: console.log('info message').
2. Refresh the page, and you will see the log output information in the Chrome console.
5. Summary
Debugging refers to the various methods used to locate, analyze, and resolve issues that arise in programs to ensure the correctness and stability of the code. Common debugging methods in EggJS include Chrome Debug for page code, VSCode Debug for backend (Resource) code, and logging tool output.
- Chrome Debug for page code: EggJS has built-in Chrome Devtools that can be used for debugging.
- VSCode Debug for backend (Resource) code: You can create configuration files in the VSCode Debug interface and save the debugging setup in the .vscode/launch.json file.
- Logging tool output: Use
app.loggerfor backend resources andconsole.logfor frontend pages.
6. Assignment
Please try using the Chrome Debug tool and logging tool output to debug a JianghuJS application, and document your debugging process and results.